Traceable
A conclusion should link back to its inputs, rules, and versions. Original texts, traditional commentary, and situation-specific interpretations each need a clear source.
From traditional rules to traceable interpretations.
BaZi and the I Ching provide the interpretive framework. Mathematical models describe structure and change. AI connects the reasoning to your question. Nexa’s algorithm design brings these three together.
Algorithm design and research directions
Seven modules and 24 formula groups address proportions, relationships, time, and interpretation. Each module has a defined role in the reasoning process.
Separate input processing, structural computation, and language interpretation: establish the basis first, then compose the answer. Keep rule versions and uncertainty with each result so its reasoning can be traced.
Give each interpretation a clear basis.
The process establishes the facts, works through the structure, assembles supporting material, and then forms an answer. Versions and uncertainty stay with the result so that its basis can be examined.



Symbol definitionsF processes facts, Z calculates structure, E holds supporting material, and A provides the explanation. V denotes versions and U uncertainty. Arrows show the processing order, not evidence of causal validity.
Conditions and scopeAI should not invent calendar calculations or rewrite a recorded casting.
The input first passes through factual and rule-based calculations to produce supporting material and uncertainty. AI then brings these together with your question to create a readable answer.


Symbol definitionsx is the raw input; F(x; v_c) transforms it into facts; Z computes structure; E and U are supporting material and uncertainty; q is your question. v_c, v_r, and v_m identify calendar, rule, and language-model versions. Theta denotes internal parameters.
Conditions and scopeThe equations describe dependencies between data and calculations. AI explanations must be based on the supporting material in E and must not change its calculated facts.
A reading should carry its version record. If rules or parameters change later, the record helps identify what caused a difference between results.



Symbol definitionstrace is the audit record. v_c, v_r, and v_m identify calendar, rule, and language-model versions. v_theta and theta_version both denote the parameter version; e and evidence_ids both denote supporting-evidence identifiers.
Conditions and scopeVersion labels and identifiers do not replace the underlying records. Reproduction also depends on retaining and being able to access the inputs, relevant versions, and necessary generation records.
Represent the Five Elements as relative parts that sum to 1. Use log-ratios to describe their internal relationships and Aitchison distance to compare structures. Combine multiple sources through a weighted geometric center.
Consider the overall proportions, beyond whether one element is abundant or scarce.
This model represents Wood, Fire, Earth, Metal, and Water as relative proportions. Their total is fixed at one, so an increase in one part changes the relative shares of the others.


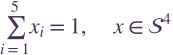
Symbol definitionsx_i is the proportion of part i. S⁴ denotes a simplex with five parts and four independent dimensions. These equations use its strictly positive interior for the logarithms that follow.
Conditions and scopeIf the raw data contain zeros, they need a clearly defined, traceable treatment before taking logarithms.
First find the geometric center of the parts, then express each part as a log-ratio to that center. Compare two states by measuring their separation in this ratio-based space.
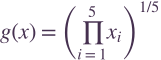


Symbol definitionsg is the geometric mean; clr is the centered log-ratio; ln is the natural logarithm; d_A is Aitchison distance; the subscript-2 norm is the Euclidean norm. x and y are the two compositions.
Conditions and scopeEvery component of x and y must be positive. A larger distance means a larger difference in relative structure, not an inherently good or bad outcome. Zero replacement and numerical precision need separate records.
Sources such as the birth chart, time period, and seasonal context are combined geometrically using their weights, then normalized to sum to one. The comparison stays focused on relative proportions rather than a source's raw total.

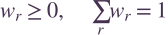

Symbol definitionsx^(r) is source r and w_r its weight. Products and powers operate component by component. C is closure, or normalization; z is the vector before closure.
Conditions and scopeSource components must meet the positivity requirement, and the closure denominator must be positive. Weights need a documented basis and version; the combination formula alone cannot determine which source is more credible.
Concentration describes whether a few parts dominate. Shift describes how far the current composition is from its background. These are structural descriptions; their interpretation also depends on traditional relationships and your question.
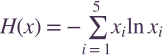


Symbol definitionsH is entropy. ln(5) is the maximum entropy for five equally weighted parts. current and background identify the two states; d_A is the distance defined above.
Conditions and scopeProportions must be positive and sum to one. Entropy can treat zeros by a limit, but Aitchison distance still requires positive parts. Concentration lies between 0 and 1; neither concentration nor shift is inherently a fortune score.
Necessary conditions determine whether a rule applies; continuous scores describe its degree once those conditions hold. Directed relationships preserve origins, destinations, and paths, bringing position, combination, and direction into a shared computational framework.
The same feature can mean different things under different conditions.
Check whether the necessary conditions hold before estimating degree. When they do not, the gate is zero. Other high indicators cannot turn that structure into one that qualifies.



Symbol definitionsz is the structure being assessed, k its category, P_k the Boolean test of necessary conditions, g_k the continuous degree function, and theta its parameters.
Conditions and scopeP_k depends on the selected sources, school, and rule version; a high score cannot redefine it. The score is an internal structural quantity, not an event probability.
For the same pair of participants, reversing the direction can change the meaning. A directed graph preserves both directions rather than compressing different effects into a single undirected label.



Symbol definitionsG is the graph. Here V means the set of nodes, not the version symbol used earlier. E_generate and E_control are generating and controlling edges; A_ij is the directed strength from i to j; z_i and z_j are the participating components.
Conditions and scopeA need not be symmetric. Signals in opposite directions can coexist and do not automatically cancel each other.
Two terms appearing together are not enough to establish a relationship. The model needs the participants, direction, required conditions, and a valid path of influence.


Symbol definitionsR is the relationship record. n, d, c, s, and v stand for participants, direction, condition, source, and version. c(z) and path_exists(z) are Boolean tests; AND requires both to be true.
Conditions and scopePairs, complete participant sets, and paths may need different rules. A shared interface must preserve those differences and allow checks of both activating and non-activating examples.
Allocate weights between cycles by their actual overlapping duration. Examine average state, variation, displacement, and changes in direction separately, comparing yearly, monthly, and daily influences along a common timeline.
Place the current change in a longer temporal context.
An interval includes its starting instant and ends just before the next interval begins. If another cycle changes partway through it, weights follow the actual overlap. Daily research must also consider the 420-day alignment of the 60-day and weekly cycles, so ordinary calendar effects are not mistaken for model effects.

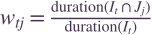


Symbol definitionsI_t is the current interval, starting at s_t. J_j are overlapping cycle intervals; duration measures elapsed time; w_tj is the overlap weight. lcm means least common multiple. The least common multiple of the 60-day and 7-day cycles is 420 days.
Conditions and scopeI_t must have positive duration. The intervals J_j must cover it without gaps or overlaps for the weights to sum to one. Time zones and solar-term boundaries must be aligned first.
Place each period's composition in the same log-ratio space, then measure the displacement between periods. Its length describes the size of the change; the angle between successive displacements helps describe a change in direction.



Symbol definitionsx_t is the composition in period t; c_t its clr transform; v_t the displacement vector; a_t its length; cos is cosine similarity between vectors; turn_t is the turning indicator.
Conditions and scopeclr requires positive components. Cosine similarity is undefined if either displacement is a zero vector; report it as unavailable or use an explicitly documented treatment. Turning thresholds require calibration.
Keep overall activity separate from direction. Two strong opposing effects can produce high total activity while their combined direction remains close to zero.
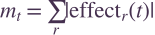

Symbol definitionseffect_r(t) is the amount of effect r at time t; direction_r is its direction vector; m_t sums absolute amounts; d_t combines their directions.
Conditions and scopeEffects need compatible scales and explicit direction definitions. A near-zero d_t does not mean nothing is happening. Neither m_t nor d_t is an event probability.
Fuzzy membership describes gradual transitions at boundaries. Perturbation analysis checks whether judgments remain stable when inputs change slightly. Limited information narrows the conclusions. Event probabilities require independent calibration and cannot be replaced by internal scores.
Identify which judgments are stable and which depend on unresolved conditions.
Very similar inputs need not receive sharply different descriptions just because they cross a hard threshold. Membership expresses their degree of fit to different states, allowing candidate results to blend smoothly.


Symbol definitionsmu_k(x) is the membership of input x in state k; c is a candidate; state_k is state k; score is the internal score under that state.
Conditions and scopeSumming to one is this model's blending convention, not an automatic property of every fuzzy set. Membership is not an event probability and cannot introduce judgments absent from the underlying rules. Function shapes still need versioning and calibration.
Repeat the calculation with plausible input variations and count how often a candidate stays in the top K. If it frequently drops out, the reading should make alternatives and sensitive inputs visible.


Symbol definitionsf produces a ranking; epsilon_b is perturbation b; D_eta describes allowed input error; B is the number of repeats; K is the number of top positions. The indicator is one when its condition holds and zero otherwise. S_c is the stability rate.
Conditions and scopeB must be a positive integer, K must fit within the candidate count, and perturbed inputs must remain valid. S_c depends on the chosen error model. It is not a career success rate, event probability, or measure of divination accuracy.
When information is incomplete, move the displayed score toward a neutral reference so that limited support does not look more precise than it is. This narrows the judgment rather than making a negative judgment about you.


Symbol definitionsHere q means completeness of the supporting information, not the user's question. s_raw is the raw internal score, s_0 the neutral reference, and s_display the displayed value.
Conditions and scopeCompleteness and the neutral reference need explicit definitions and compatible score scales. A low q does not mean a job or relationship is unsuitable. With severely limited information, precise rankings may be withheld.
A probability for an event defined in advance must be evaluated against actual outcomes. Brier measures squared differences between probabilities and outcomes; Log Loss imposes a larger penalty on confidently wrong predictions.
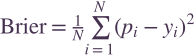

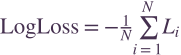
Symbol definitionsN is the sample count, p_i the predicted probability for event i, and y_i the observed outcome, either 0 or 1. L_i is the log-likelihood of observation i under its predicted probability; Log Loss is the negative mean of these values.
Conditions and scopeN must be positive. Direct logarithms require 0<p_i<1; endpoints need limits or documented numerical treatment. Evaluation needs independently held-out data and calibration curves; rare events also require base rates, precision, recall, and PR-AUC. High accuracy does not replace calibration, and internal scores cannot simply be renamed probabilities.
Describe six-step line generation through state representations, conditional transitions, and joint probabilities. Each step uses only information available at that time and retains a full generation record. Turning off observation coupling restores the specified traditional independent baseline.
Study the generation of a hexagram separately from its interpretation.
In the OCQM-6 research representation, a density matrix organizes the state, and corresponding projections give probabilities for the four line values. Probabilities must be nonnegative and sum to one.




Symbol definitionsI is the set of internal line values; rho_t is the density matrix at step t; P_i projects onto state i; Tr is the matrix trace; p_t(i) is the resulting probability. The symbol ≽0 means positive semidefinite.
Conditions and scopePositive semidefiniteness is a property of the whole Hermitian matrix, not a requirement that every entry be nonnegative. The projectors must form a complete, mutually exclusive set of states. This mathematical representation uses quantum probability without requiring quantum hardware.
The current distribution passes through a history-dependent transition kernel to form the next distribution. Observation information may enter the research model, but every update must preserve valid probabilities.



Symbol definitionsi and j are source and destination states; T_t is the conditional transition kernel. h_t contains results so far, selective observation states, and filtered context. p_t denotes the internal state distribution given the current history. This is not an identity for unconditional marginal distributions.
Conditions and scopeFor each fixed history, every row of T must be nonnegative and normalized; checking only the sum of the entire matrix is insufficient. This keeps the probabilities at each step valid.
The model needs a baseline it can return to. With stationary correction enabled, the traditional baseline remains unchanged by transition. With observation coupling turned off, generation must return exactly to that independent baseline.



Symbol definitionspi is the specified traditional baseline, T_t the transition kernel, lambda the observation-coupling strength, and y_t the value of line t. With lambda=0, observation coupling is off: both the initial distribution and each transition return to pi, and the six-line joint probability equals the product of the individual baseline probabilities.
Conditions and scopepi must itself be nonnegative and sum to one. Stationarity is not independence: pi T=pi does not replace exact fallback when coupling is off. The new mechanism still needs comparison with the independent baseline and simpler sequence models.
Multiply each step's probability given its available history to obtain the probability of the complete six-line sequence. This preserves possible dependence between steps and allows the generation process to be checked step by step.


Symbol definitionsy_1 through y_6 are generated line values; y_<t is the preceding sequence; h_(t-1) is the available history; the product symbol multiplies across steps. Step one uses the initial history h_0.
Conditions and scopeEvery conditional distribution must be valid, and history may use only information available before that step. The product is calculated for a specified observation mechanism and context. If history includes additional random information, it must be explicitly conditioned on or included in the joint model; the expression cannot simply be treated as the unconditional joint probability of the line values.
Once a line value has been generated, record it before displaying the coins. Refreshing or retrying a request should retrieve that same result, giving the reading a stable starting point.





Symbol definitionsy_t is the generated line value; event is its persisted generation record; h_t is updated history. r and request_id both identify the same request. Arrows show the order of generation, storage, display, observation, and update.
Conditions and scopeA retry is not a new draw. Coins are a conditional display; derived hexagrams must be computed deterministically from the six generated lines without rewriting that casting's state.
Organize calculated results, rules, conflicts, and scope into a supporting package for AI to interpret in the context of the question. Check coverage, omissions, and contradictions separately so fluent language does not conceal gaps in the reasoning.
Keep the answer connected to the basis of the reasoning.
Before answering, AI receives facts, rules, conflicts, and uncertainty. It can organize and explain them, but cannot change calculated facts or invent events that have not occurred.




Symbol definitionsE contains facts, rules, conflicts, scope, and versions. U contains missing information, sensitivity, disagreement, and calibration information. q is the question, s the safety policy, LLM the language model, and A the answer. Unmet conditions also belong in the supporting records.
Conditions and scopeThe supporting package needs to trace back to specific evidence_ids; the presence of fields does not establish that their contents are sufficient. Calculated facts, traditional interpretations, model synthesis, and practical suggestions need to remain distinguishable.
Check how many verifiable claims are supported, how many required items are missing, and how many checked pairs contradict each other. These measures make aspects of explanation quality open to specific questions.



Symbol definitionssupported_claims and checkable_claims count supported and verifiable statements. omitted_required_items and required_items count missing and required items. contradictory_pairs and checked_pairs count contradictory and examined pairs of statements.
Conditions and scopeA zero denominator makes the ratio unavailable, not zero or a perfect score. Definitions must be applied consistently, alongside blinded human review and user research. These ratios measure fidelity to the supplied material, not divination's real-world predictive validity.
A conclusion should link back to its inputs, rules, and versions. Original texts, traditional commentary, and situation-specific interpretations each need a clear source.
Compare results again when the input changes slightly. Define structural scores, stability rates, and event probabilities separately so distinct measures are not conflated.
AI connects the reasoning with the specific situation. Ask why, add context, and gradually clarify the conditions on which a judgment depends.
These formulas describe Nexa’s algorithm design; they do not establish predictive validity. OCQM-6 is a research model for generating six-line sequences. It uses the mathematics of quantum probability, without quantum hardware.

Bring Nexa what matters to you—in relationships, work, or life choices—and explore it through BaZi and the I Ching.
Explore my question with Nexa